Monitor EJBCA host using Monit
The following instructions describe how to set up Monit to monitor EJBCA host variations.
Monit is an open-source monitoring utility that can be used to monitor servers and trigger alerts in case of errors. By integrating EJBCA and Monit, you can monitor the health of your EJBCA application, application server, database management system (DBMS), as well as Apache HTTP Server (H TTPD), if applicable. With Monit, you can view the status of your monitored services in the web interface (dashboard) and configure email notifications for when issues arise.
List of the technology stack used in this guide:
AlmaLinux 9.0
EJBCA version 7.10.0.1
WildFly24
MariaDB version 10.5.16
Apache version 2.4 front-end reverse proxy running on ports 80 and 443
Step 1 - Configure EJBCA health check service
The EJBCA health check servlet offers several application-level points to be monitored, see Monitoring and Healthcheck for more information. This guide outlines how to enable and monitor the CA health check.
Enable CA HealthCheck
In EJBCA, use the CA Activation page or the Edit CA page to enable CA health check for monitoring. Note that a testKey needs to be available in the crypto token, see Certificate Authority Overview.
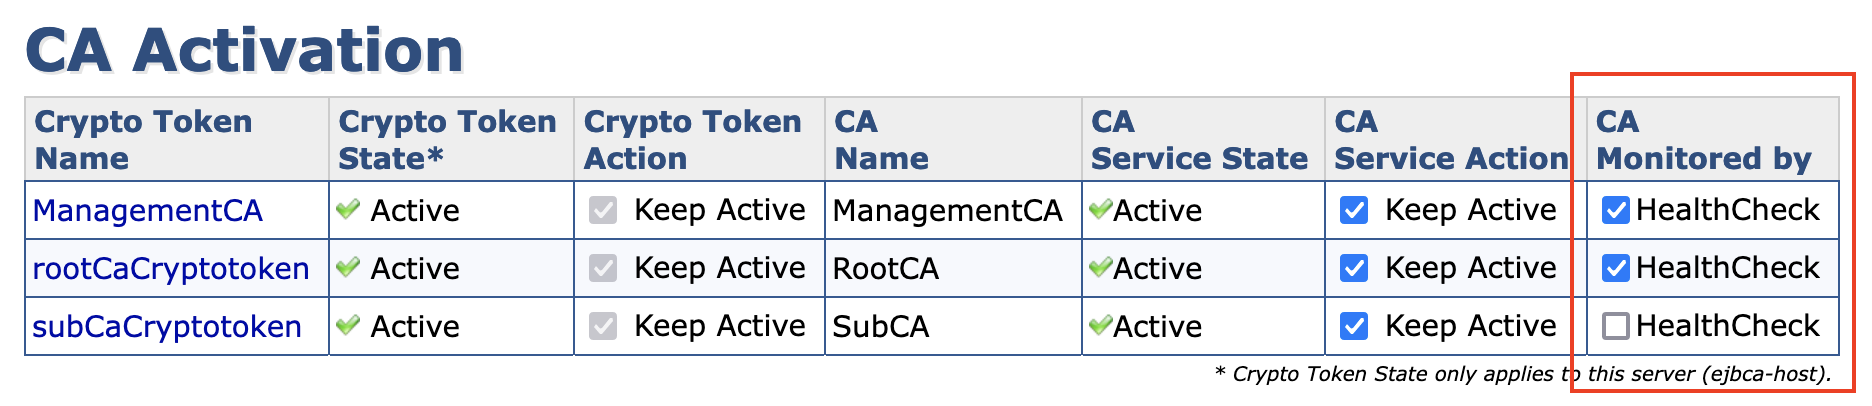
To enable the CA health check service on the CA Activation page:
In EJBCA CA UI, under CA Functions, click CA Activation.
Select the desired CAs to be monitored.
Point your browser to the following URL to reach the health check status over HTTP:
http://<ejbca-host>:<port>/ejbca/publicweb/healthcheck/ejbcahealth
Track status output
Add a script to track the output of the health check URL. The output will be processed and displayed in the Monit interface. Polling intervals and alerts can be configured in the control file, see Step 3 - Configure Monit.
To add a bash script for the EJBCA health check:
On your server , create ejbcahealthcheck.sh:
[root@alma90~]# vi /opt/ejbcahealthcheck.shIn the editor, add the following contents to ejbcahealthcheck.sh and then save:
#!/bin/bashstatus=$(curl -s http://localhost:8080/ejbca/publicweb/healthcheck/ejbcahealth | sed -e 's/<[^>]*>//g')if["$status"=="ALLOK"] ; thenecho"EJBCA is OK!"exit0elseecho"NOT OK!"echo"${status}"exit1fiAdd exe cute permissions:
chmod +x /opt/ejbcahealthcheck.sh
Step 2 - Install Monit
To install Monit, you can either build it from source or install it via OS package managers.
Build Monit from source
To build Monit from source, refer to Monit on Bitbucket.
Install Monit using OS package managers
RHEL-based systems (provided via the EPEL release, refer to Extra Packages for Enterprise Linux):
sudo yum updatesudo yum install monitMacOS:
brew install monitDebian-based systems:
sudo apt-get updatesudo apt-get install monitTo display version details, run:
[root@alma90 ~]# monit --versionThis is Monit version 5.32.0Built with ssl, with ipv6, with compression, with pam and with large filesCopyright (C) 2001-2022 Tildeslash Ltd. All Rights Reserved.Step 3 - Configure Monit
By default, Monit provides a default configuration control-file named monitrc located at /etc/monitrc (Linux) that contains sample configuration examples.
Follow the steps below to create a new customized configuration file and update the configuration file to align with the services you want to monitor. Depending on your needs, this can range from being minimal without alerts to including additional services and email notifications.
To create a customized Monit control file, using a minimal or additional services example configuration, follow these steps:
On your server, run the following:
[root@alma90~]# vi ~/.monitrcUpdate your new custom configuration file with one of the following example configurations, and then save the file:
Minimal configuration: The following provides a minimal example configuration:
# Globalset daemon30# check at30seconds intervalsset log syslog# Monit host and portset httpd port2812andallow admin:monit # require user'admin'with password'monit'# EJBCA Healthcheckcheck program EJBCA[Healthcheck] with path /opt/ejbcahealthcheck.shifstatus !=0then alertAdditional monitored services configuration: The following provides an example configuration including additional services to monitor, and an option to trigger outbound email notifications via SMTP. Note that the example values for memory, usage, and so on are just sample values and may need to be adjusted for your environment and server resources.
# Globalset daemon30# check services at30seconds intervalsset log syslog# Monit host and portset httpd port2812and# use address localhost # only accept connection from localhost (dropifyou use M/Monit)# allow localhost # allow localhost to connect to the server andallow admin:monit # require user'admin'with password'monit'# with ssl { # enable SSL/TLS and set path to server certificate# pemfile: /etc/ssl/certs/monit.pem# }## EJBCA Healthcheckcheck program EJBCA[Healthcheck] with path /opt/ejbcahealthcheck.shifstatus !=0then alert# Networkinterfacecheck network Interface[Bridge] withinterfaceens160iflink down then alertiflink down then alertifchanged link then alertifsaturation >90% then alertifdownload >10MB/s then alertiftotal uploaded >1GB in last hour then alert# System resourcescheck system localhost[$HOST]ifloadavg (1min) per core >2for5cycles then alertifloadavg (5min) per core >1.5for10cycles then alertifcpu usage >95%for10cycles then alertifmemory usage >75% then alertifswap usage >25% then alert# MariaDBcheck process MariaDBwith pidfile /var/run/mariadb/mariadb.pidstart program ="/usr/sbin/service mysql start"with timeout60secondsstop program ="/usr/sbin/service mysql stop"with timeout60secondsiftotalmem >400MBfor5cycles then alertiftotalmem >600MBfor5cycles then restartifcpu >60%for3cycles then alertifcpu >80%for3cycles then restartif2restarts within7cycles then timeout# httpdcheck process HTTPD with pidfile /var/run/httpd/httpd.pidgroup apachestart program ="/usr/bin/systemctl httpd start"stop program ="/usr/bin/systemctl httpd stop"ifcpu usage >70%for10cycles then restartif5restarts within10cycles then alert# Wildflycheck process Wildfly matching'standalone.sh'start program ="/usr/bin/systemctl wildfly start"stop program ="/usr/bin/systemctl wildfly stop"iftotalmem >3GBfor2cycles then restartifcpu usage >90%for5cycles then restartif5restarts within10cycles then alert# Filesystem storagecheck filesystem localhost[/boot] with path /dev/nvme0n1p1ifspace usage >70%for5times within15cycles then alertcheck filesystem localhost[/root] with path /dev/mapper/almalinux-rootifspace usage >80%for5times within15cycles then alert############################################################################set eventqueuebasedir /var/monit # set the base directory where events will be storedslots99999# optionally limit the queue size############################################################################# SMTP settingsset mailserver smtp.yourdomain.tldport465username"noreply@yourdomain.tld"password"pa$$wOrdHere"using auto# Email recipientset alert name.surname@company.com# Message settingsset mail-format {from: Monit <noreply@yourdomain.tld>subject: monit alert -- $EVENT $SERVICEmessage: $EVENT Service $SERVICEDate: $DATEAction: $ACTIONHost: $HOSTDescription: $DESCRIPTIONRegards,MonitBot}################################################################################# Includes################################################################################### It is possible to include additional configuration parts from other files or## directories.#include /etc/monit.d/*#
Update the control file permissions:
chmod700/root/.monitrcOnce you have configured the services that you want to include for monitoring, and before launching the Monit web interface in the next step, run a syntax check for the control file:
monit -t
Step 4 - Start Monit
Once you have configured the control file, you need to start (and enable) the monit service.
To start Monit as a service and enable it to start automatically on boot, run the following:
<sudo> systemctl start monit<sudo> systemctl stop monit // to stop<sudo> systemctl enable monit // to enable on bootStep 5 - Access monitored data
The monitored data can be reached via the Monit web interface or the command line.
Access Monit web interface
To access the Monit web interface and view the status of your monitored services, navigate to the host URL and port defined in the configuration control file in Step 3 - Configure Monit.
Open a browser and go to the host URL and port:
http://<host-or-IP>:2812Sign in using the default HTTP Basic Authentication username=admin and password=monit.
The following displays examples of monitored data and the information displayed in the Monit Service Manager.
Monitoring examples - Minimal monitored services
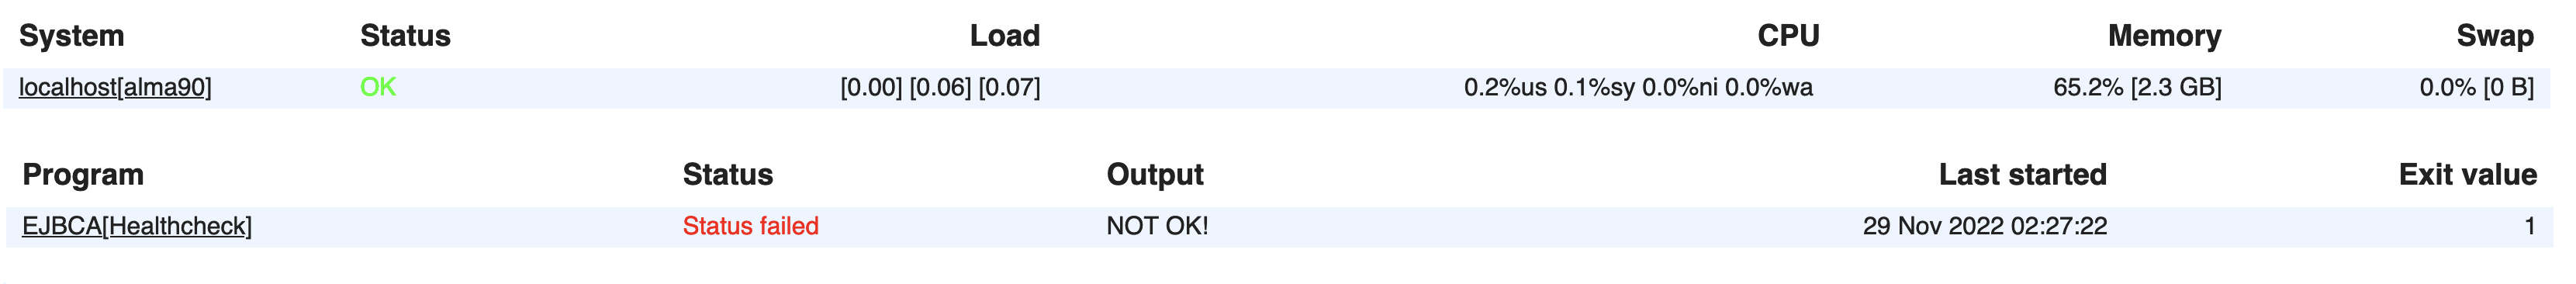
Displaying minimal monitored services:

With minimal monitored services and the EJBCA health check in status failed:
Monitoring examples - Additional monitored services
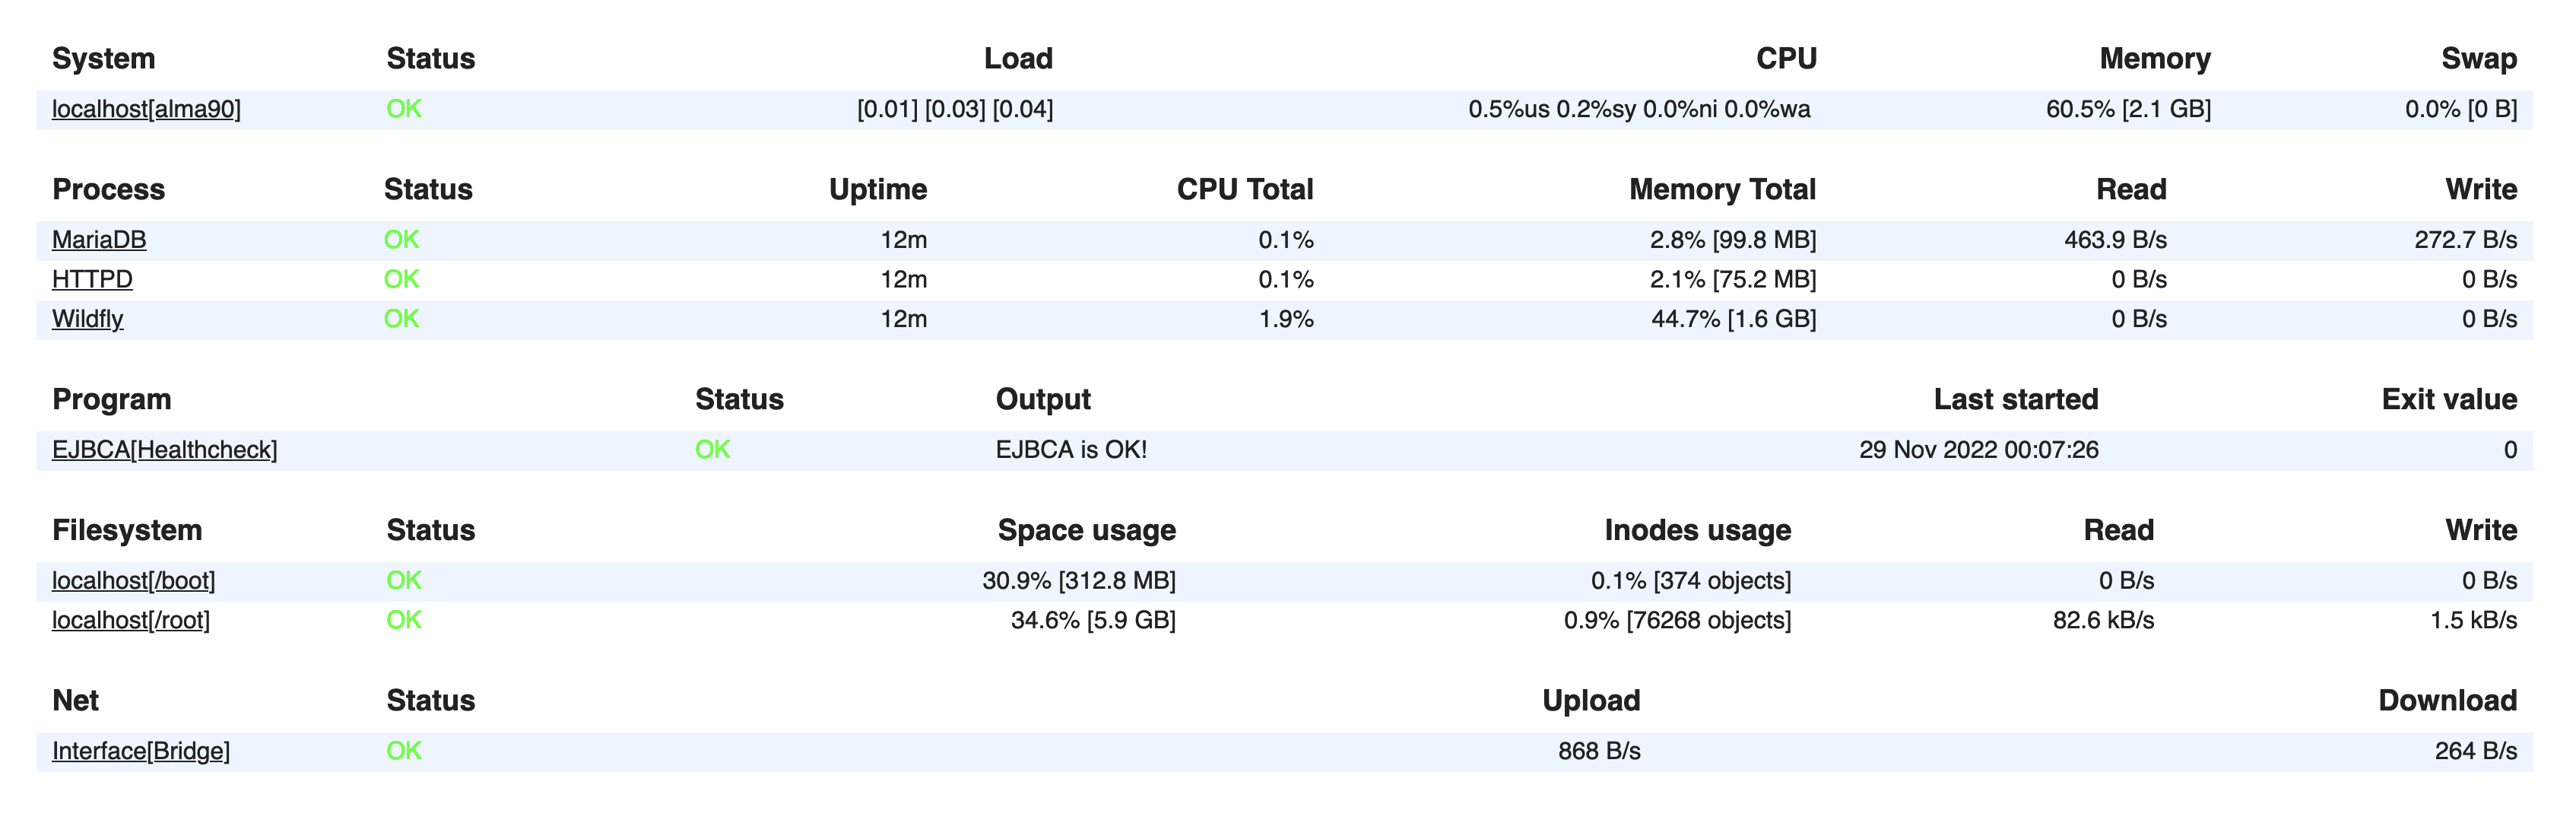
Displaying additional monitored services:
Additional monitored services and the EJBCA health check in status failed:
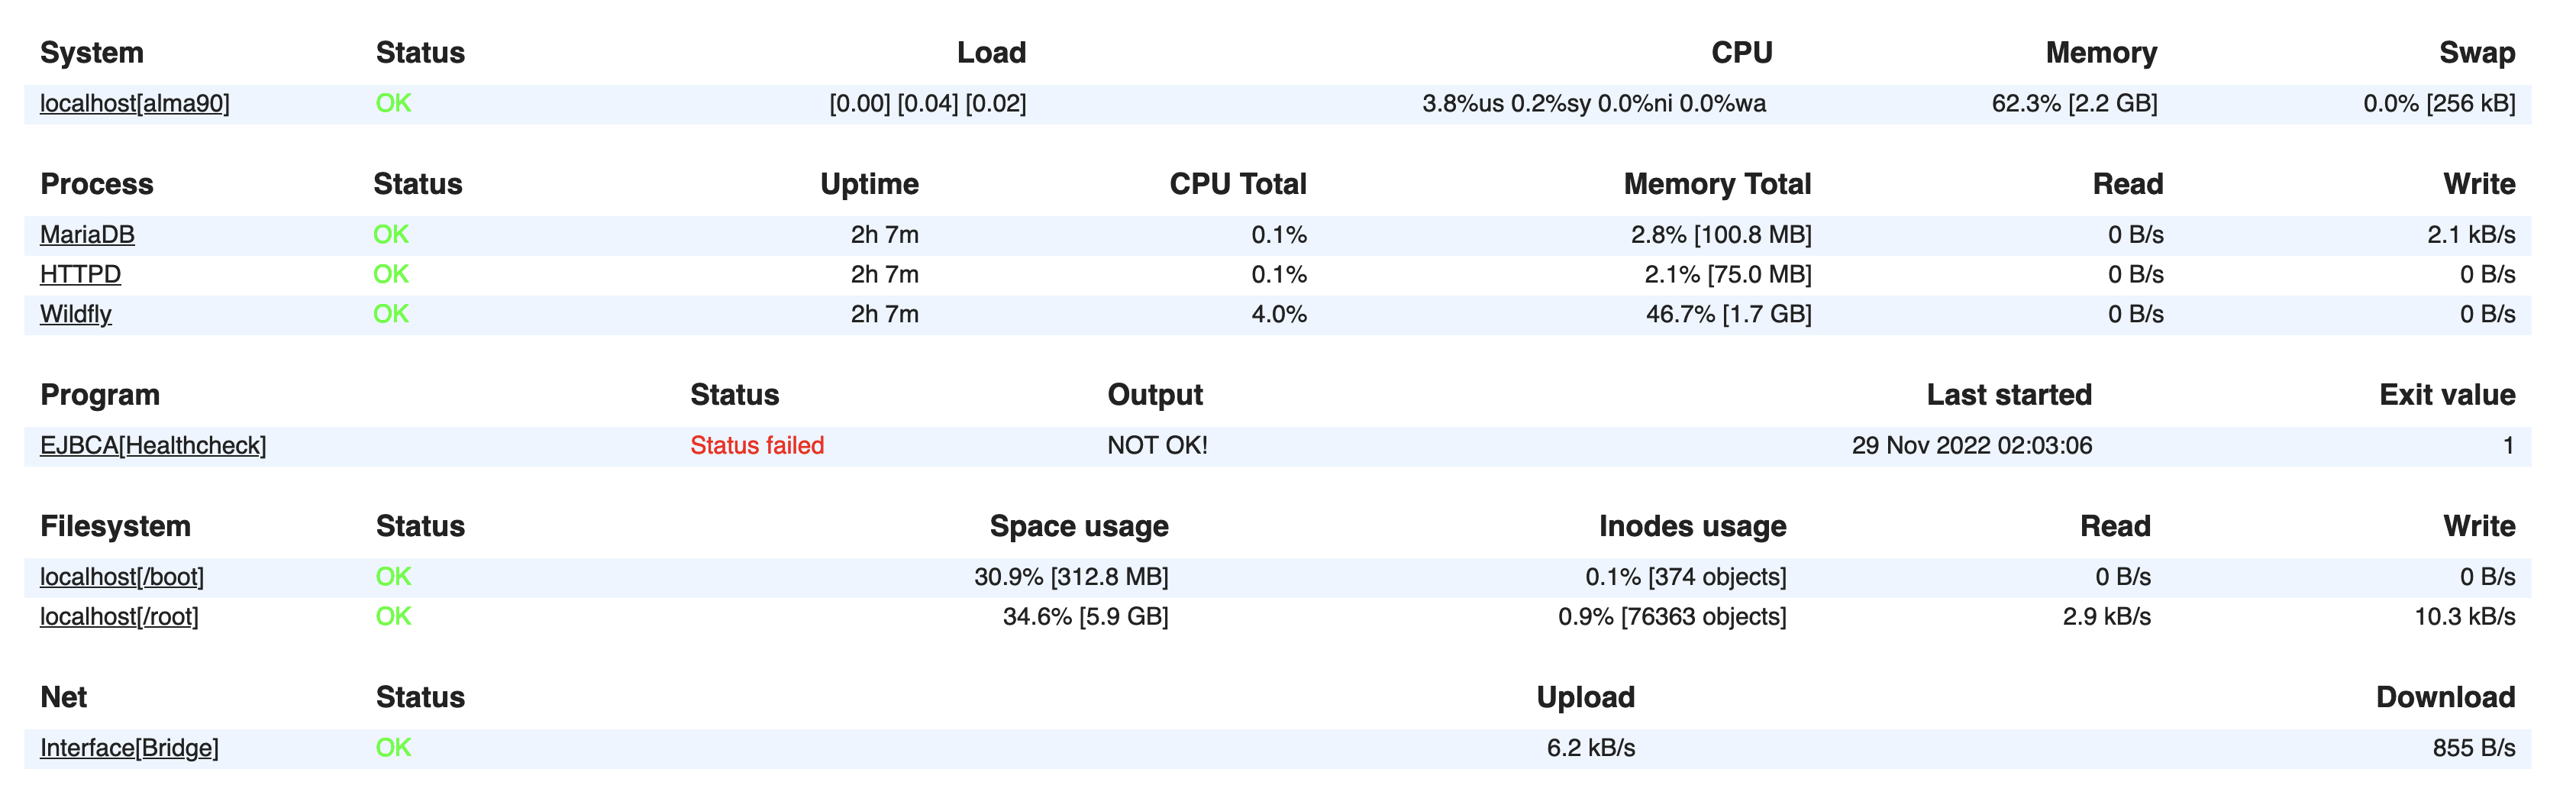
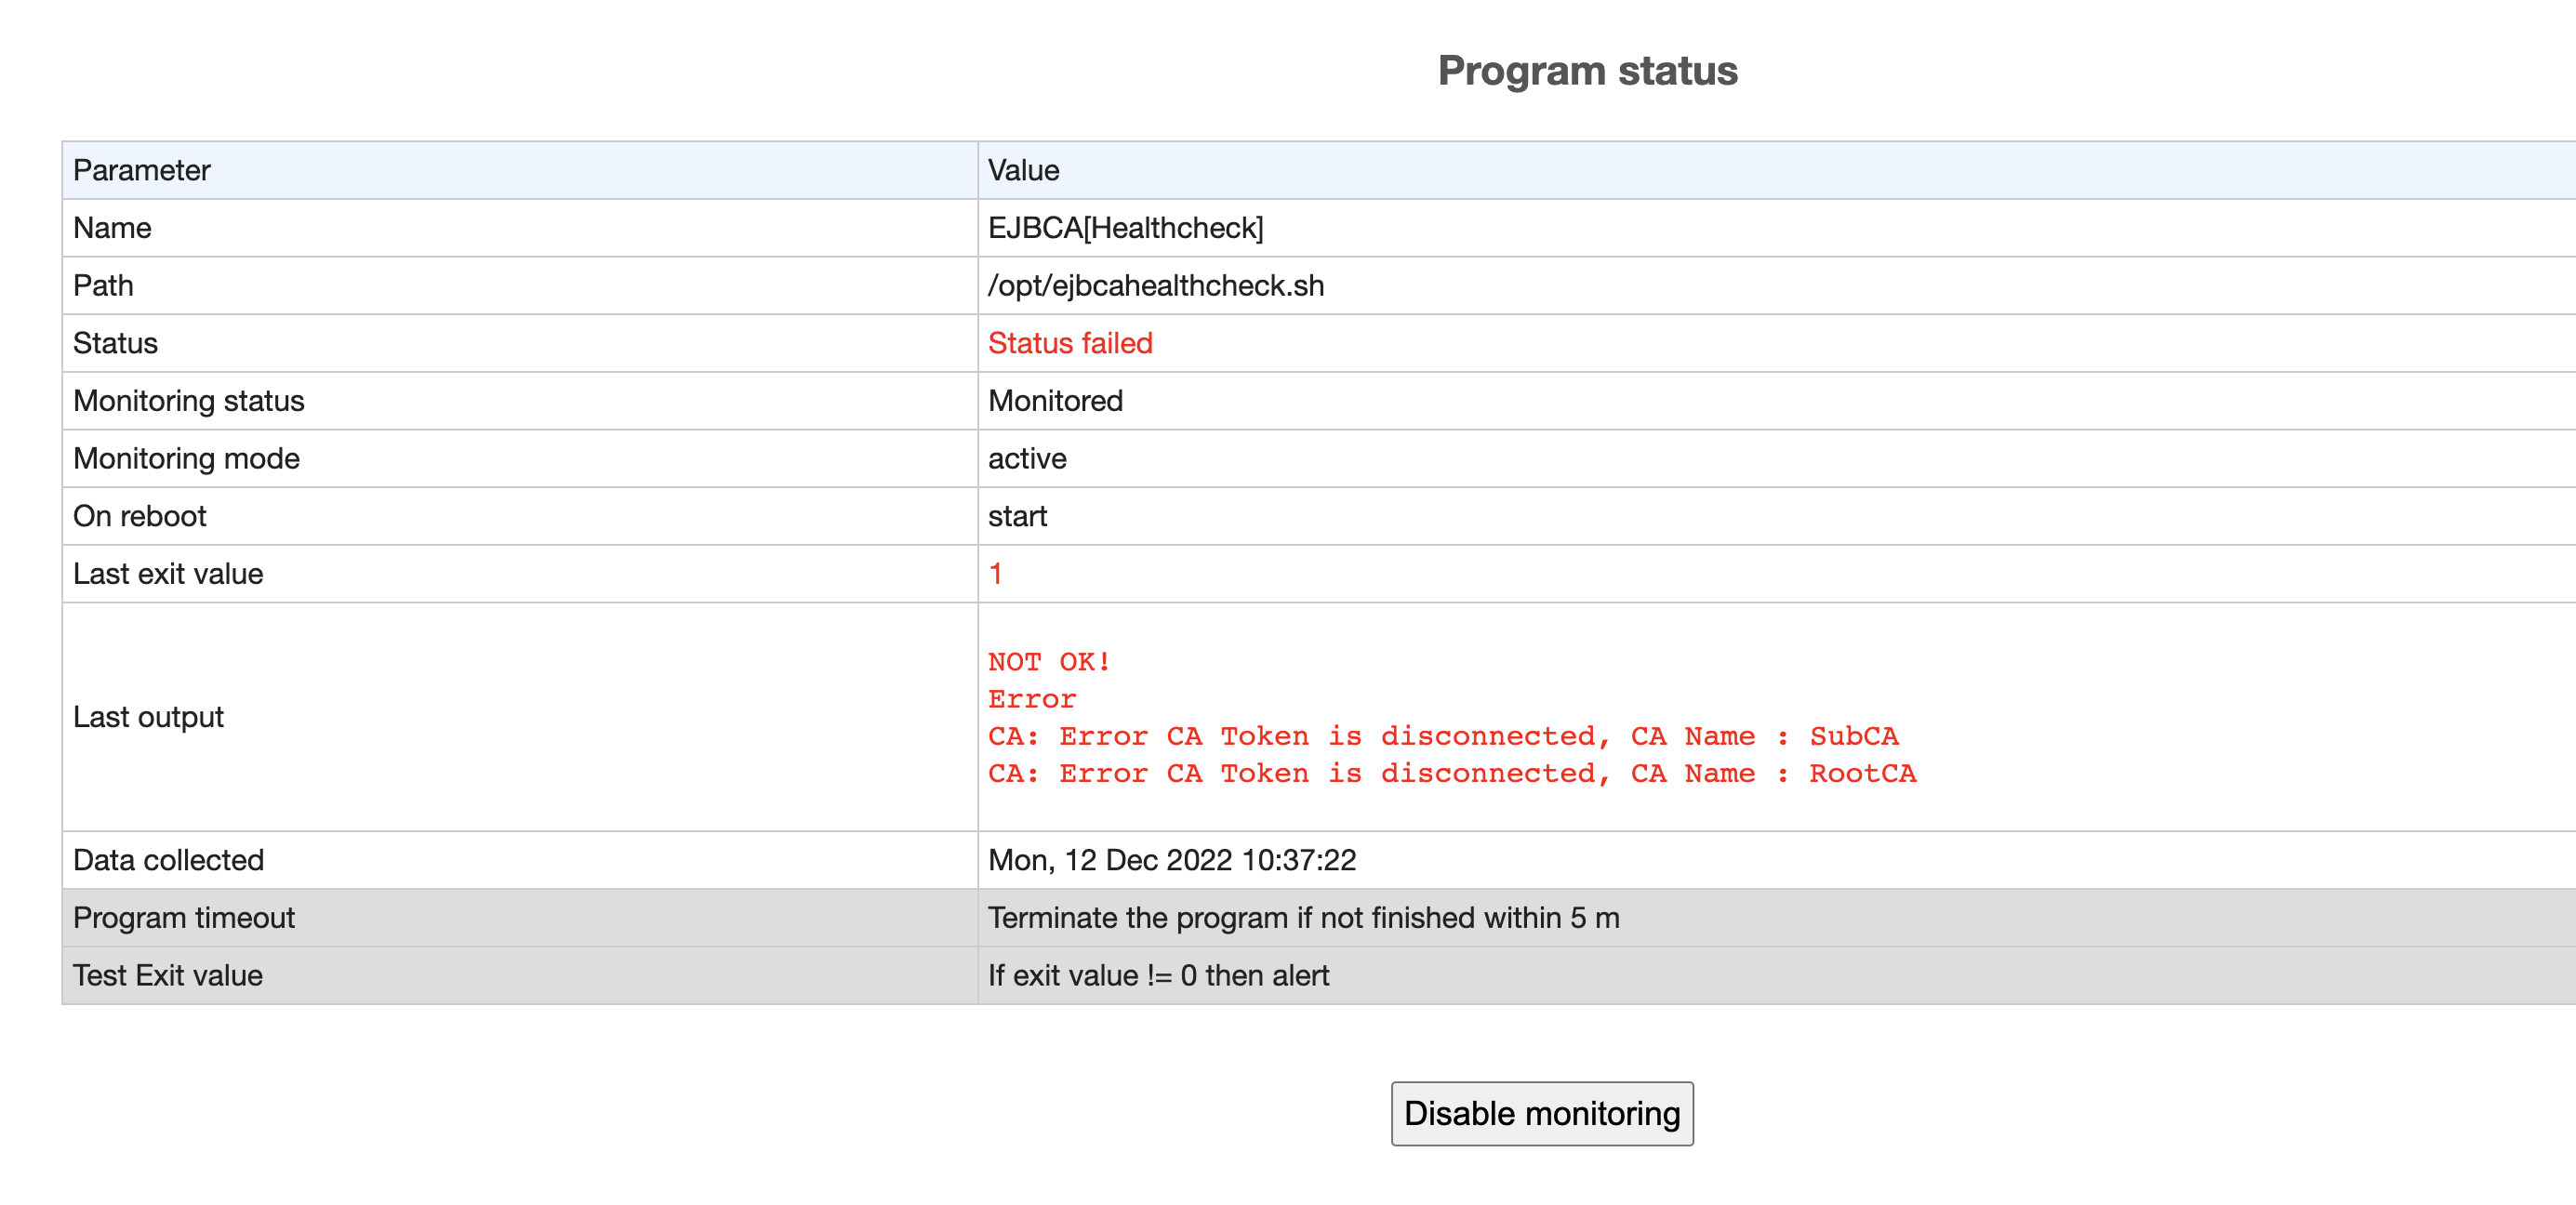
Click EJBCA[Healthcheck] under Program to view details of the failed event, including native messages returned from the EJBCA health check. Example of Monit Program status:
Monitor services from the command line
You can also monitor the services from the command line and view the status of all monitored services, for example.
To print service status information:
On your server, run:
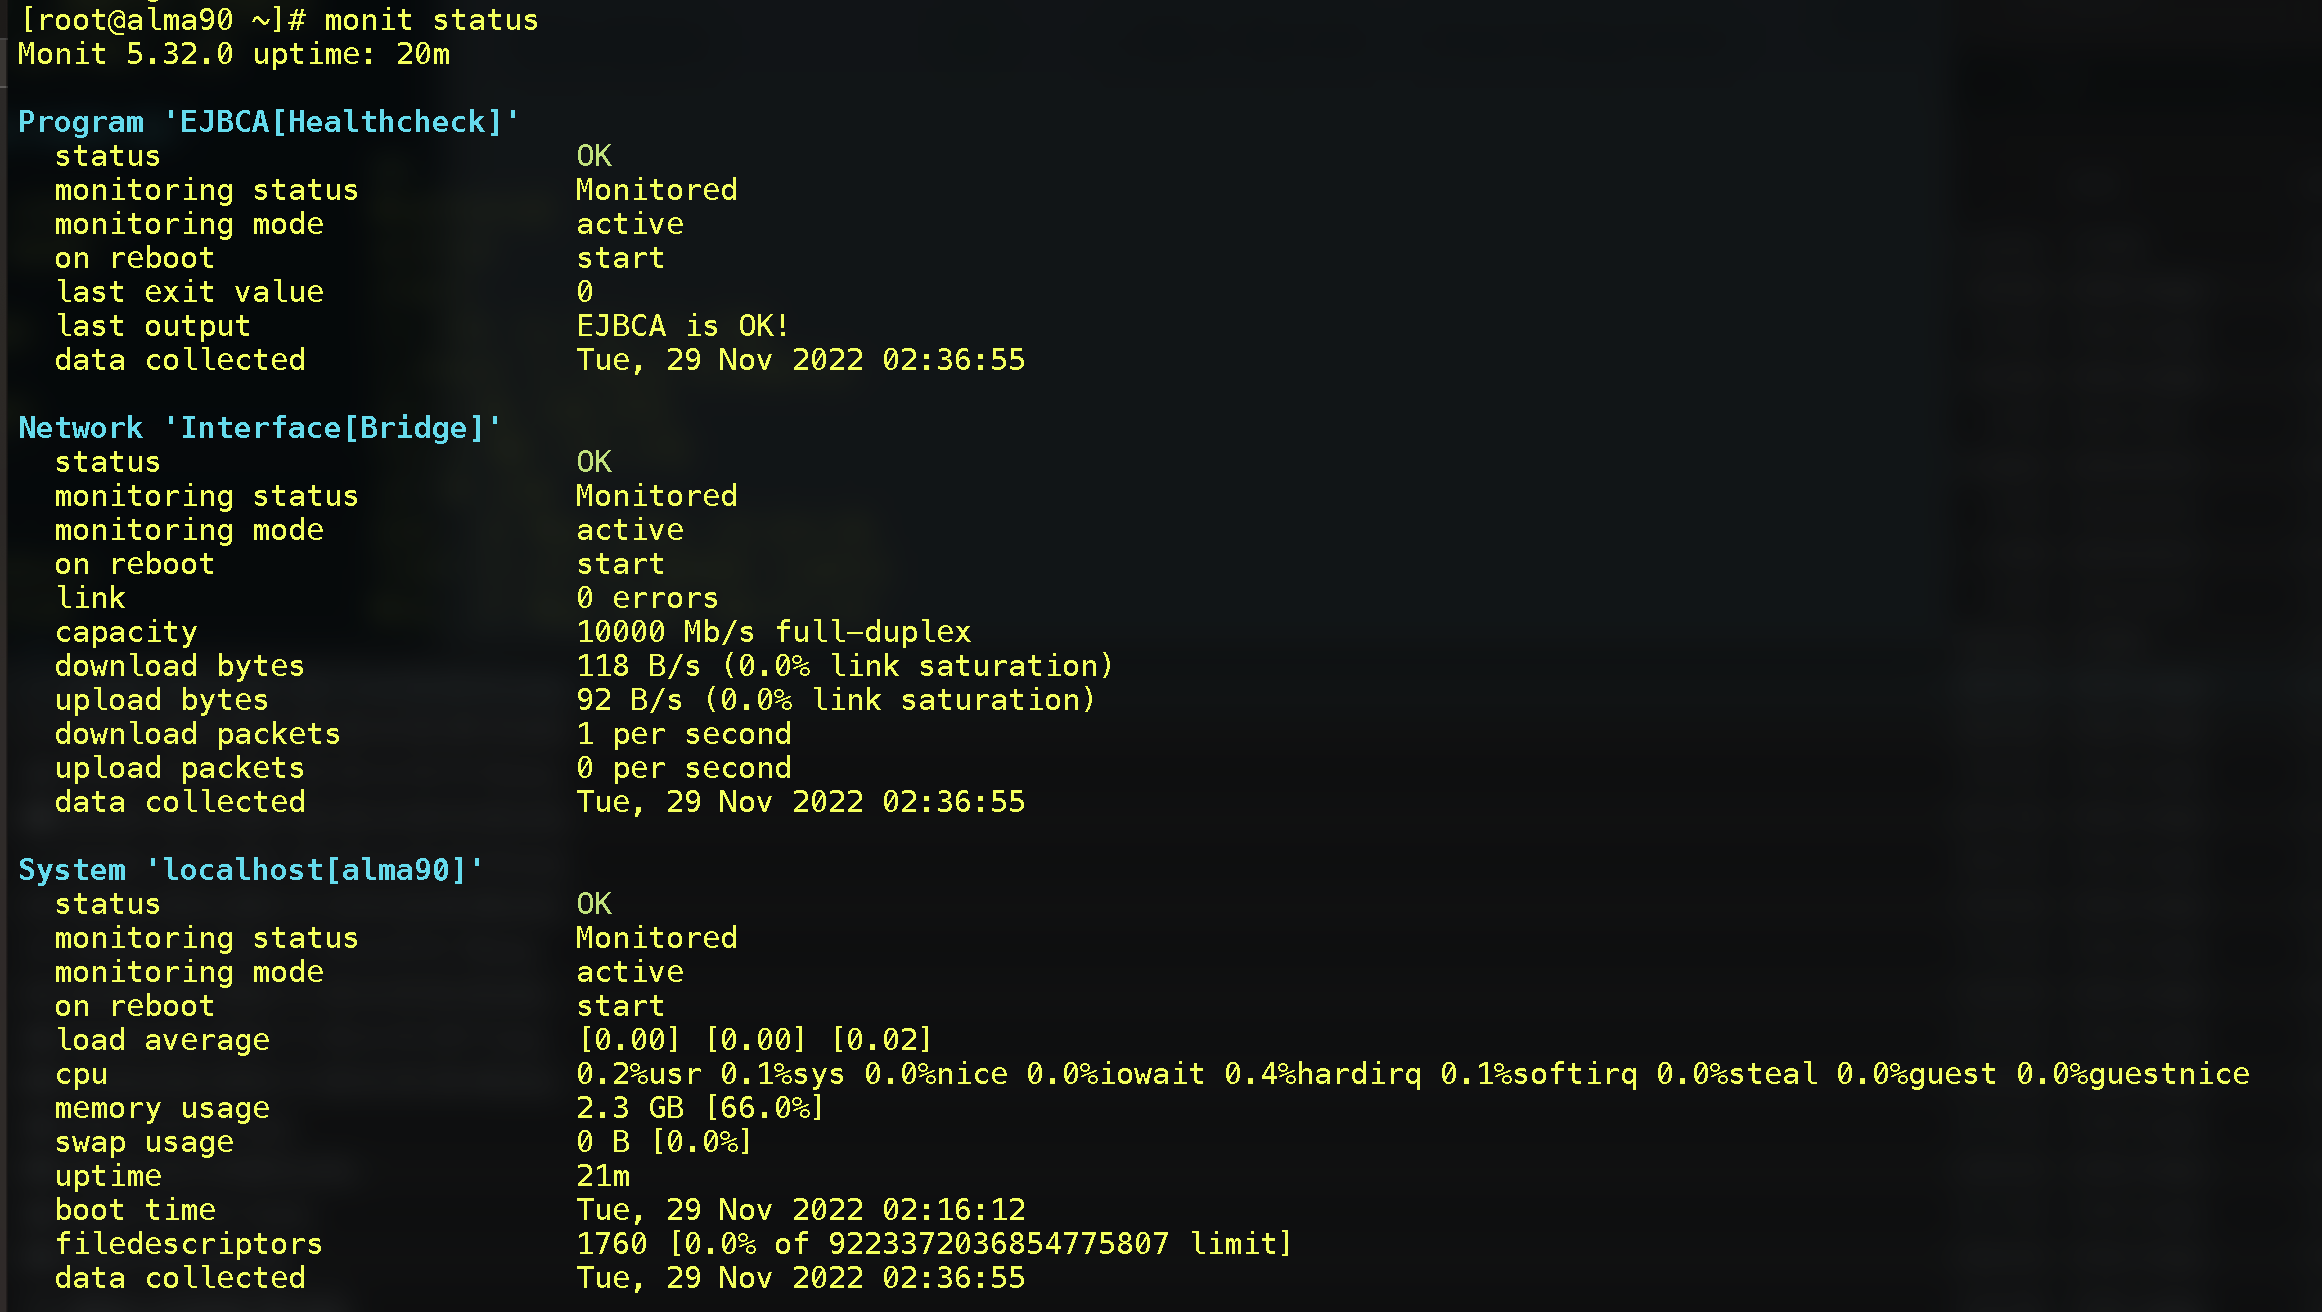
monit statusThe output will look something like the following:
Email notification examples
The following provides examples of email notifications:
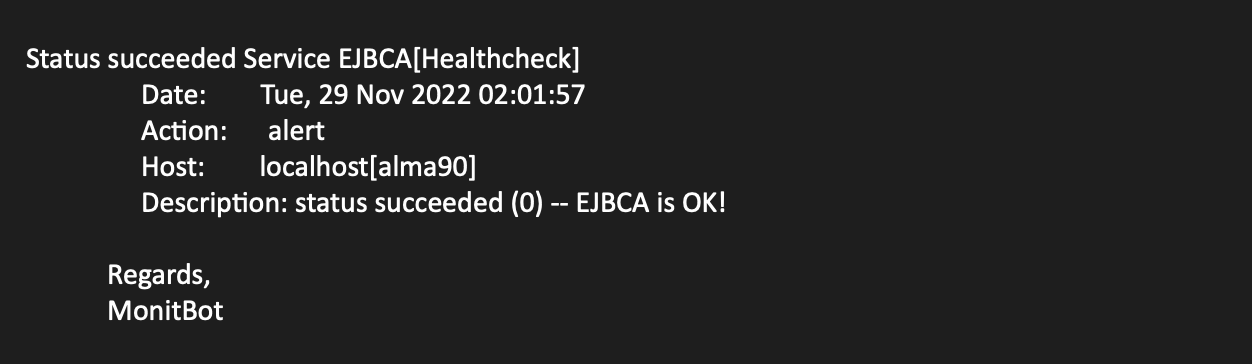
Status succeeded notification:
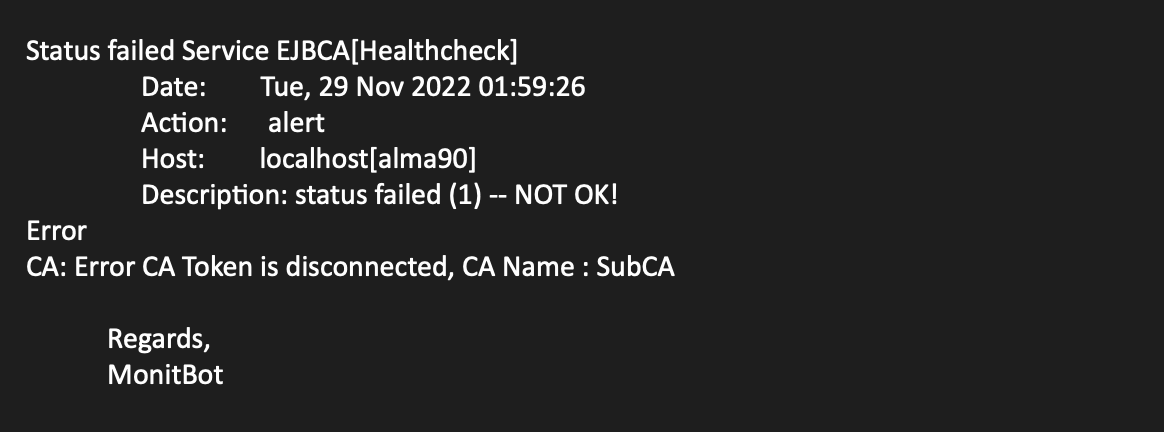
CA status failed notification:
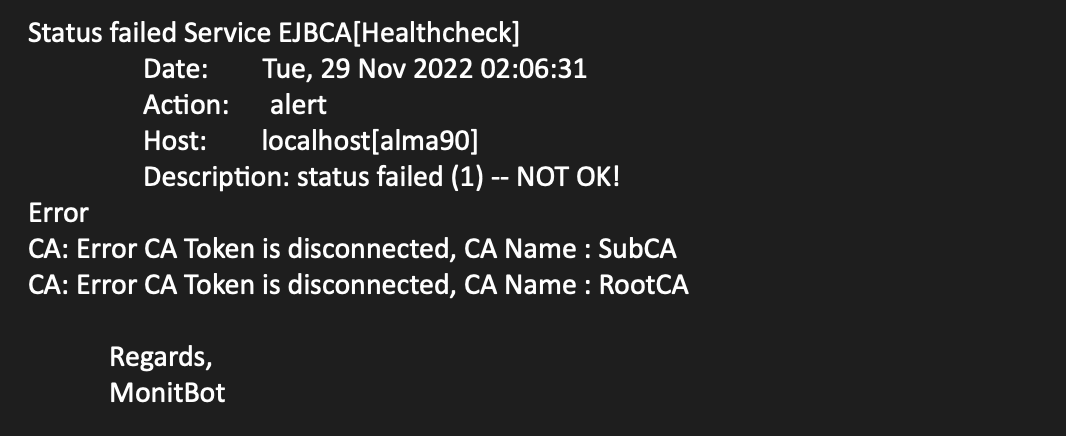
Status failed notification (with more than one failed CA):
Useful Monit commands
The following lists some useful Monit commands and options. For a list of all available arguments and options, refer to the Monit documentation.
Print service status information (in the terminal):
monit statusReload all daemon(s):
monit reloadStop all running daemon(s):
monit stop allRun syntax check for the control file:
monit -tStart the service using a different control file:
monit -c /path/to/control-fileNext steps
Monit also allows you to monitor files, directories, and filesystems for changes, such as timestamp changes, checksum changes, or size changes. For more information, refer to the Monit documentation.
To learn more about the EJBCA health check service used for health monitoring, see Monitoring and Healthcheck.
To learn how to get started with EJBCA Community as a Docker Container, you can follow the Quick Start Guide - Start EJBCA Container with Unauthenticated Network Access.
To find out more about EJBCA use cases, see Solution Areas.